By: Team F10-3 Since: Aug 2019 Licence: MIT
1. Introduction
This portfolio provides an overview of the CS2103/T Revision Tool and highlights my contribution in the project including a brief description of the key features that I implemented.
1.1. The Team
Our team of 5 consists of 2 Year 4 Engineering Science students, a Year 2 Computer Science / Business student, a Year 3 Communications and New Media student and myself, a Year 4 Industrial & Systems Engineering student.
1.2. About the Project
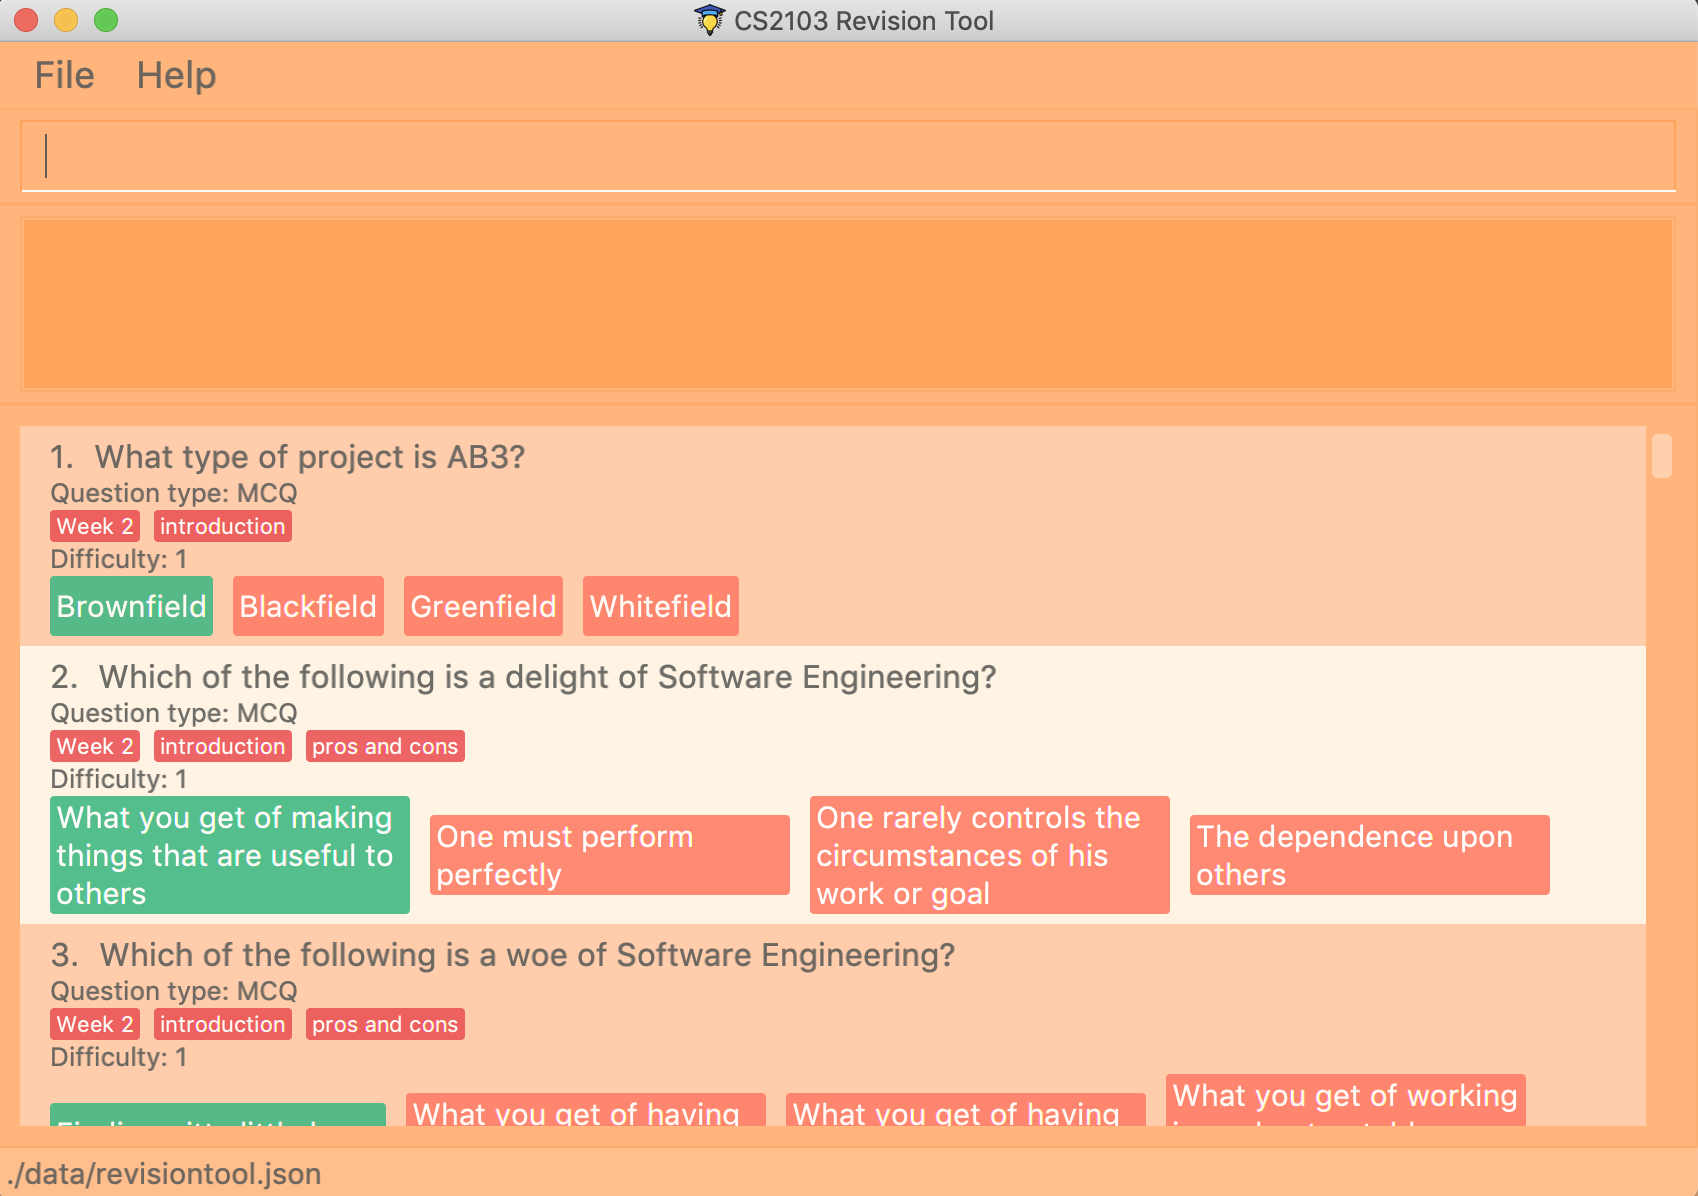
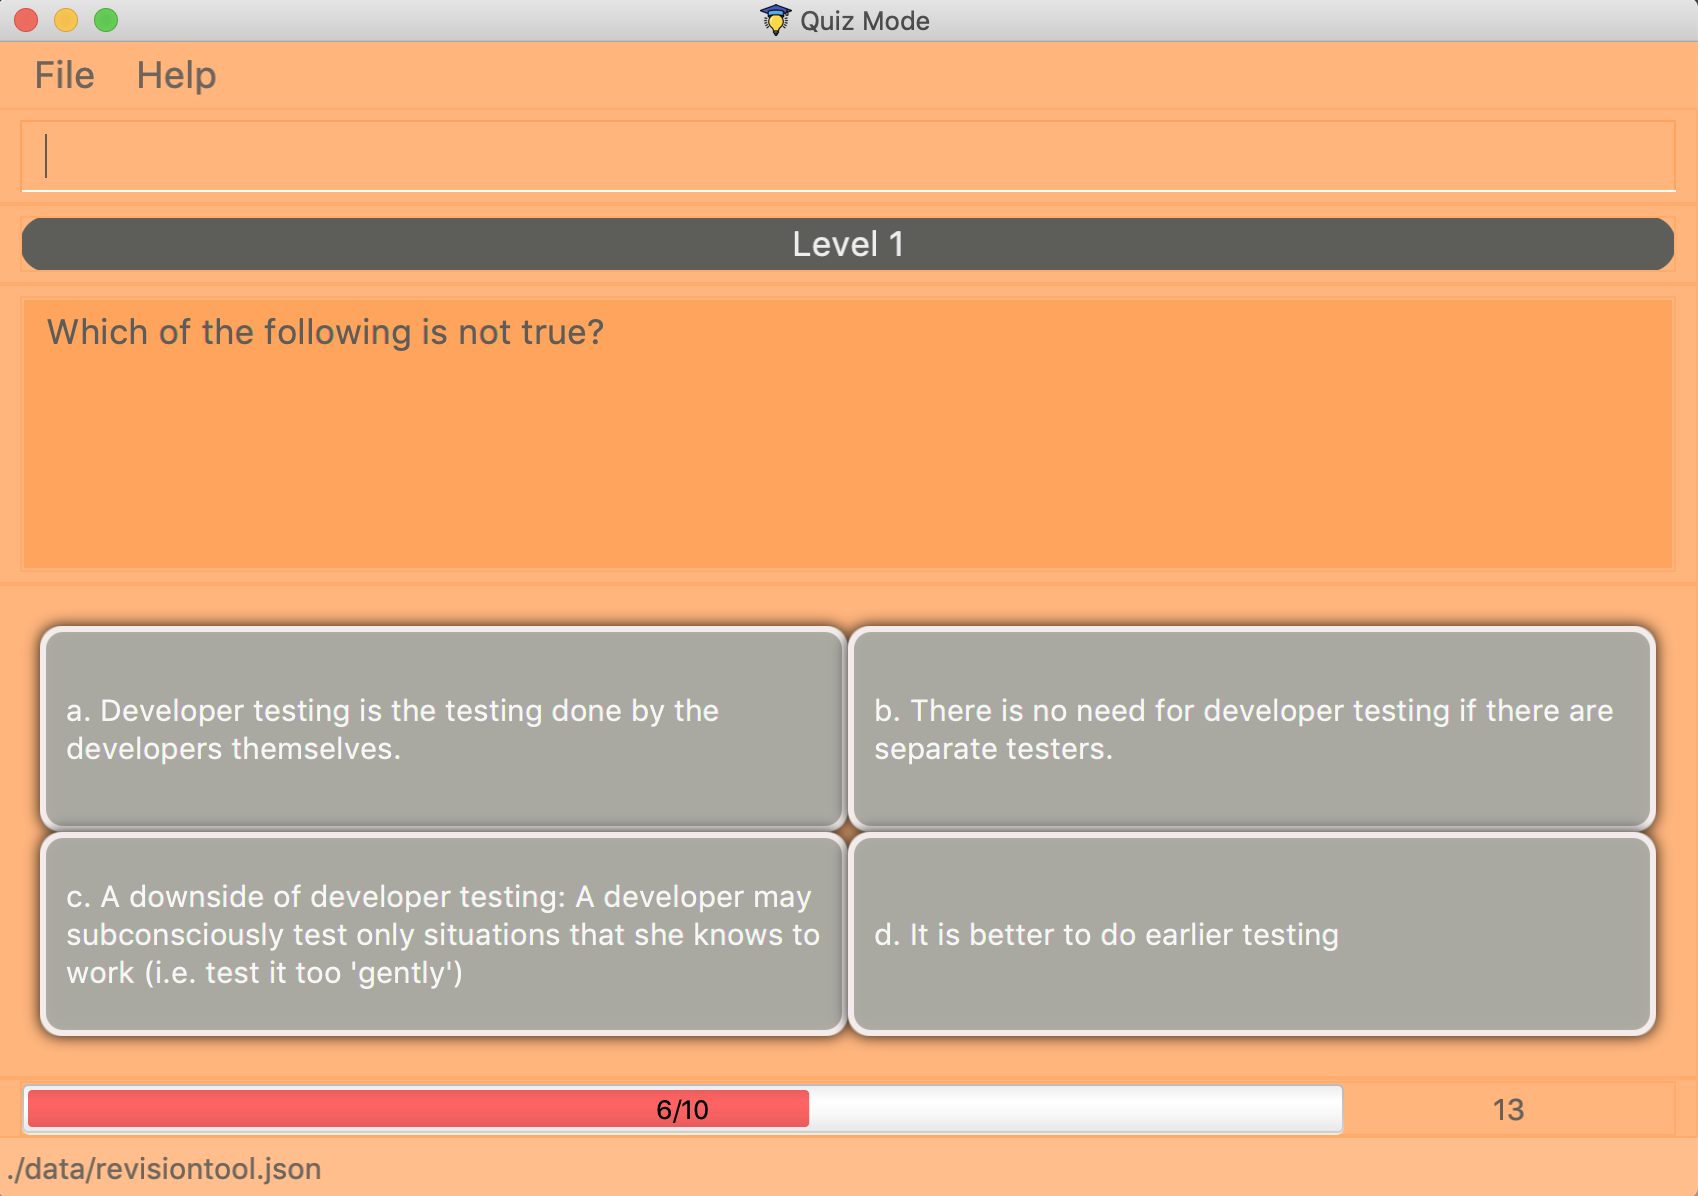
This 7-week project was started as part of NUS' Software Engineering (CS2103/T) module. The team was required to to either morph or enhance an existing application (Address Book - Level 3). Our team decided to morph the project into the CS2103/T Revision Tool (RT), a desktop quiz application which allows users to create their very own personally customised question banks and attempt these questions in the format of timed quizzes in an interactive manner later on. The user interacts with it using a Command Line Interface (CLI), and it has a Graphical User Interface (GUI) created using JavaFX. It is written in Java, and has about 14 kLoC.
2. Summary of contributions
As a member of the project, I have volunteered to set up the project on GitHub and invited all of the group members into our team Repo. I have helped out in milestones and project management. I have been actively monitoring the build status of our project on GitHub. Furthermore, I developed the data analytics part of the application.
-
Major enhancement: added data analytics for the quiz
-
What it does:
statscommand generates and displays a list of past results of quiz attempts and their respective breakdown into scores for each difficulty levels. For each quiz attempt, the application also indicates to the user which type of questions the user did the worst in.historycommand shows the raw history of all quiz results and its breakdowns by difficulty levels to the user. This feature also indicates the number of quizzes attempted by the user so far. -
Justification: This essential feature aids in keeping a record of all quiz results. The feature carries out some data processing and analytics before reporting these extra information back to the user in a proper format. This feature significantly improves the product by providing additional helpful information to the user so as to aid in improving his or her quiz scores and ultimately her revision outcome.
-
Highlights: This enhancement required the deep understanding of the entire project structure including the new quiz driver feature that forms the backbone of the project. It involves passing and retrieving of information from UI to Storage. Some tests were written for this feature. The
HistoryClass is created for subsequent storage of any statistical information of past quizzes. -
Credits: Code for the GUI display and storage of information of this feature was adapted from Address Book – Level 3.
-
-
Minor enhancements: added the delete multiple questions feature for the app
-
Enabled
deleteto remove multiple questions at once based on listed index in configuration mode.
-
-
Code contributed: You can view the code I contributed to this project here, window=blank
-
Other contributions:
-
Project management:
-
Managed releases v1.1 - v1.2 (2 releases) on GitHub
-
Managed and resolved issues actively throughout project duration.
-
-
Enhancements to existing features:
-
Wrote tests for Statistics and History related features created by me.
-
-
Documentation:
-
Created sequence diagrams for
StatsCommandfeature and class diagram for storage component of the app -
Created sequence diagram to better explain how history of quiz results is updated after every successful completion of quiz.
-
-
3. Contributions to the User Guide
Given below are sections I contributed to the User Guide. They showcase my ability to write documentation targeting end-users. |
3.1. Check your progress: stats

Displays the percentage of questions answered correctly by difficulty, for all quiz attempts. Indicates to user which difficulty level he or she is weakest in. This feature only records results for the normal mode of quizzes.
Format: stats
Example:
Total: 68.42%
-
Difficulty 1: 100.00%
-
Difficulty 2: 100.00%
-
Difficulty 3: 14.29%
-
Please prioritise this type of questions: Difficulty 3
3.2. More data analytics [coming in v2.0]
3.2.1. More statistics stats
Users will be able to view average scores across all attempts of quizzes.
They will also be able to view statistics not just for difficulty levels, but also for individual categories.
This will help them to prioritise and know exactly which type of questions they are weaker at.
This feature will also indicate to users further that overall across all quiz attempts which type of questions
needs to be prioritised. In addition, with all these in mind, users can then make use of the custom quiz mode in
section 4.3 to get more practise on specific types of questions.
3.2.2. Graphs history
Currently, as of v1.4, this command only shows a raw full history of scores and their breakdown
by difficulty levels for all past quiz attempts. The number of quizzes attempted by the user in total is also shown
in the results display. By v2.0, users will be able to view line graphs of their history of quiz attempts' results
by categories and difficulty levels. This will show them how much they are progressing in their quiz results for
each different type of questions.
Stats/History: Hitting Enter again after executing a stats or history command will return you
back to configuration mode displaying the question bank.
|
4. Contributions to the Developer Guide
Given below are sections I contributed to the Developer Guide. They showcase my ability to write technical documentation and the technical depth of my contributions to the project. |
4.1. Data Analytics
4.1.1. Overview
There are many ways to present additional data to the user. While looking at user stories and deciding what our
target audience will need, we realised that one important information needs to be present - the type of questions
that user performs the weakest in. In order to present this information to the user, we needed a way to record
results of quizzes, store these results, break down these results according to question types and report the type
of questions that the user has performed badly in. These will be showcased in the stats command feature.
4.1.2. Implementation
updateStatistics feature
Quiz results are first recorded by successful completion of quizzes in Normal mode. At each quiz attempt,
a Statistics object is first initiated. Every correct answer parsed by the user will trigger the code snippet below
to updateStatistics.

The sequence diagram for interactions between the Logic component and the Model component, from
parsing of a correct answer in the Logic component to updating the Statistics class in the Model component is
already shown above in Figure 11.
updateHistory feature
After the user successfully completes a quiz in Normal mode, History will be updated with this 'Statistics' object.
History serves as a storage component for quiz results. This is done using the code snippet shown below.
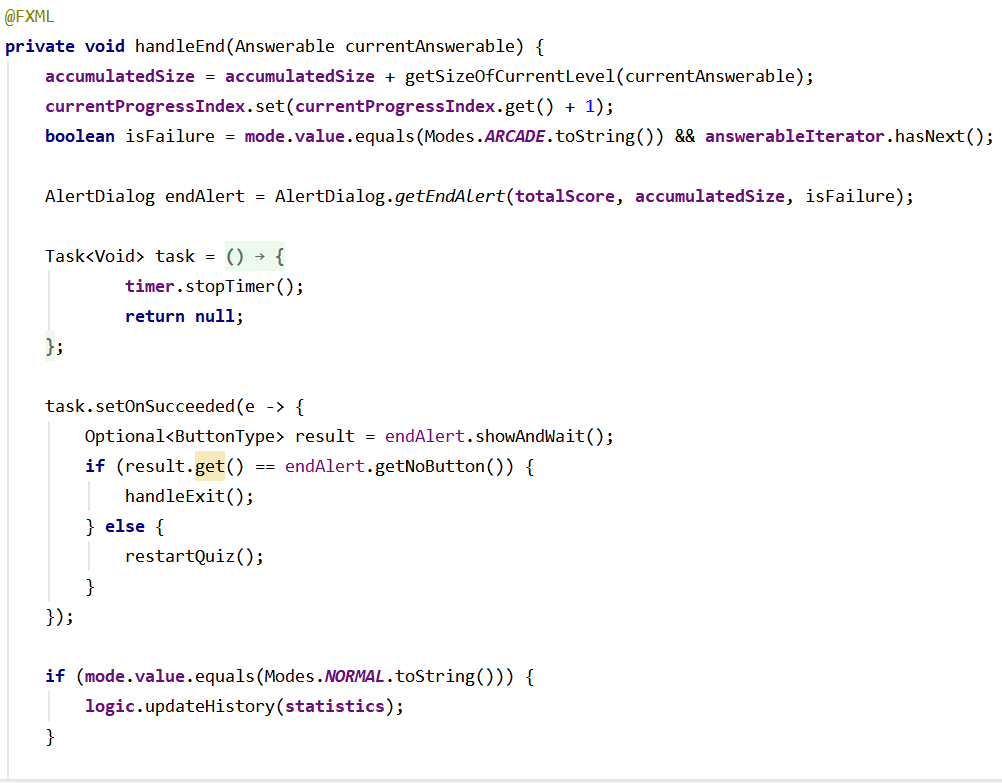
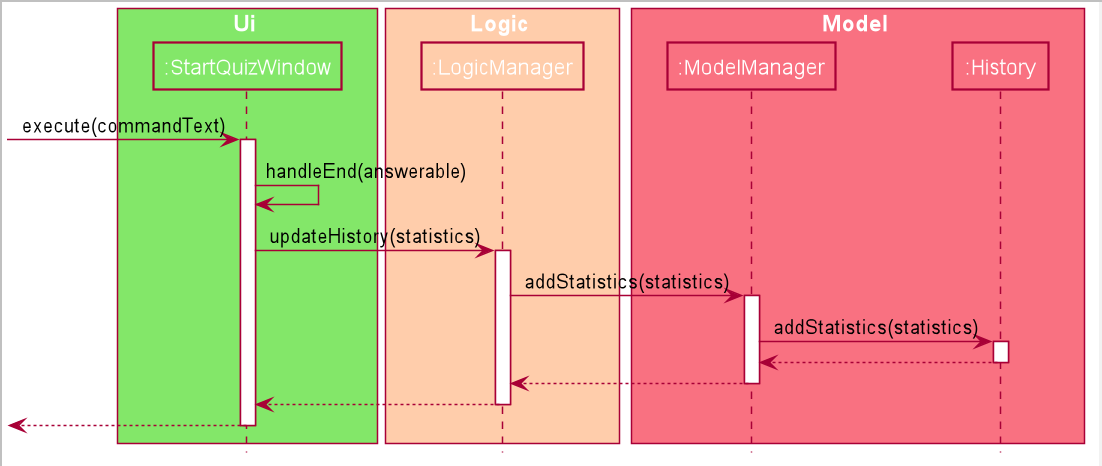
Given below is the sequence diagram for interactions between the`Ui`component, Logic component and the
Model component, from handling the end of a quiz in the Ui component to updating the History class
with the Statistics object in the Model component.
Stats Command Feature
Given below is the sequence diagram for interactions within the Logic component for the execute("stats") API call.
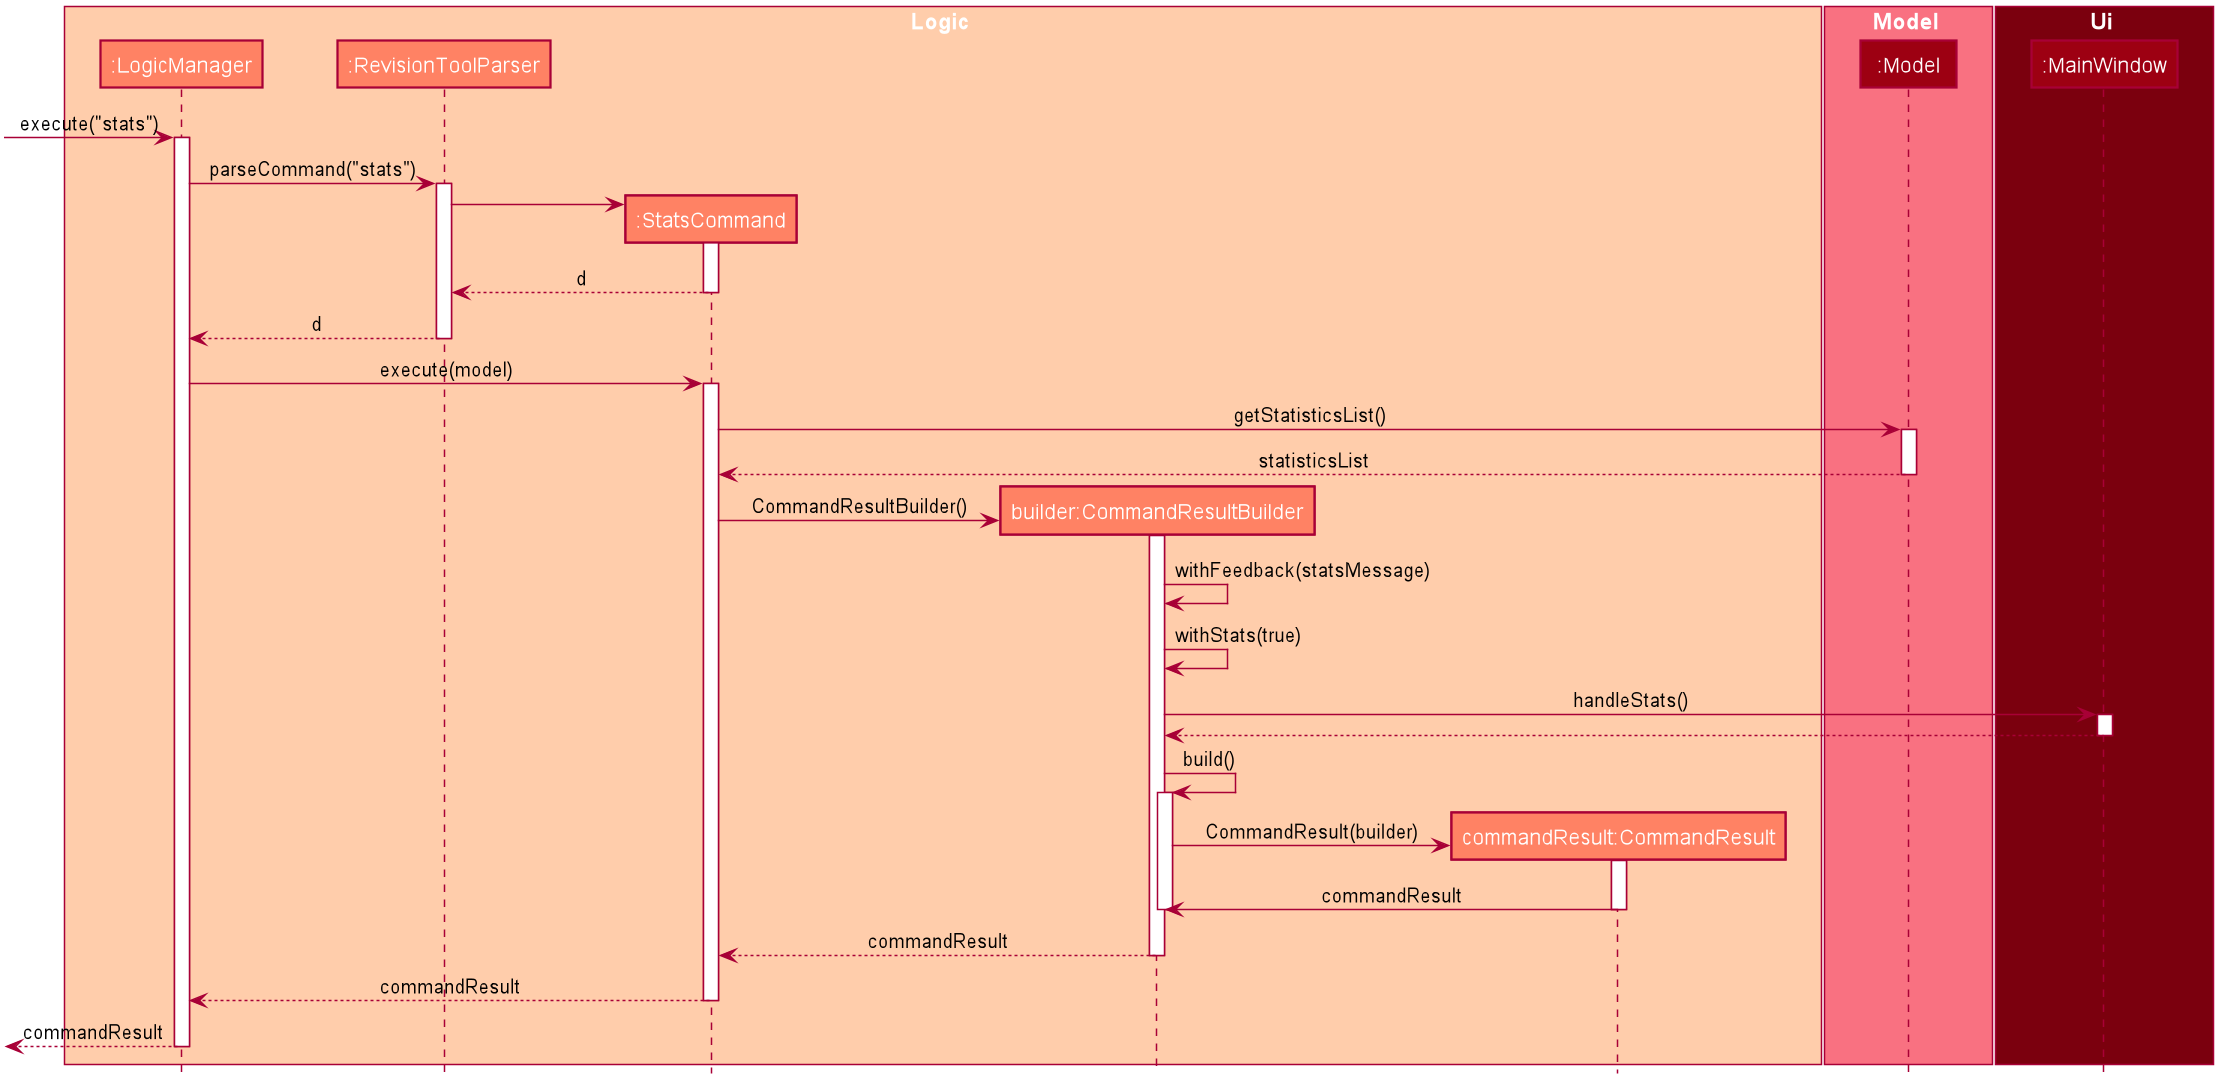
The stats command will first activated the parser in Logic before executing the StatsCommand.
This will then get the list of past statistics of quiz results from the model before sending a feedback
to the user through the CommandResultBuilder. The CommandResultBuilder will trigger the
handleStats method to finally show the list of statistics in the MainWindow through the Ui.